Server or VDS Monitoring: Munin
Munin is a straightforward monitoring tool for UNIX systems, allowing users to visualize system parameters like CPU load and memory usage. Its simple installation makes it accessible for effective server monitoring.
Server or VDS Monitoring: Munin
There are many different monitoring systems - ranging from the most primitive ones that check the operation of individual services or parameters, to complex management systems. Today we will look at Munin - a very simple tool from the configuration standpoint, which allows logging and visualizing the status of UNIX systems.
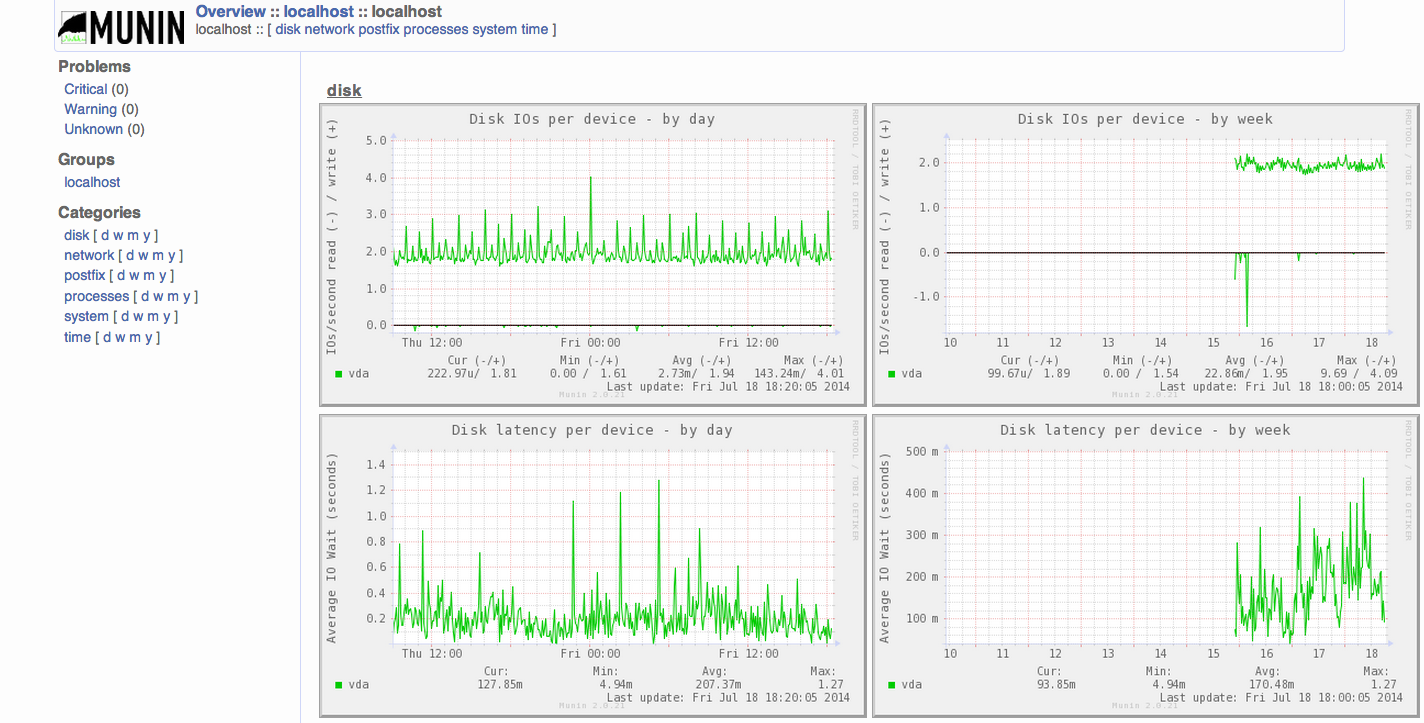
Even with a basic installation, Munin can monitor essential parameters such as memory usage, CPU load, disk usage, and network activity. If necessary, additional modules can be connected, and diagnostic messages configured to be sent under specific conditions.
An undeniable advantage of Munin is its ease of installation. Let’s install this monitoring package on our SSD VDS based on CentOS with the ISPManager panel.
Installation Steps
First, connect to the EPEL repository and install Munin and RRDTool, which is used for data visualization:
rpm -Uvh http://download.fedoraproject.org/pub/epel/6/x86_64/epel-release-6-8.noarch.rpm
yum --enablerepo=epel install munin munin-node rrdtool
Next, modify /etc/httpd/conf.d/munin.conf to suit your needs:
Alias /munin /var/www/html/munin
<Directory /var/www/html/munin>
    Options FollowSymLinks
    AllowOverride None
    Order allow,deny
    Allow from all
    AuthUserFile /etc/munin/munin.htpasswd
    AuthName "Munin"
    AuthType Basic
    require valid-user
    ExpiresActive On
    ExpiresDefault M310
</Directory>
ScriptAlias /munin-cgi/munin-cgi-graph /var/www/cgi-bin/munin-cgi-graph
Since authentication is enabled for access, you need to create a user and set a password:
htpasswd -cm /etc/munin/munin.htpasswd monitor
The installation is now complete. Isn’t it simple? Now, enable auto-start for munin-node and start your monitoring system:
/etc/init.d/munin-node start
chkconfig munin-node on
Restart Apache for the configuration changes to take effect:
service httpd restart
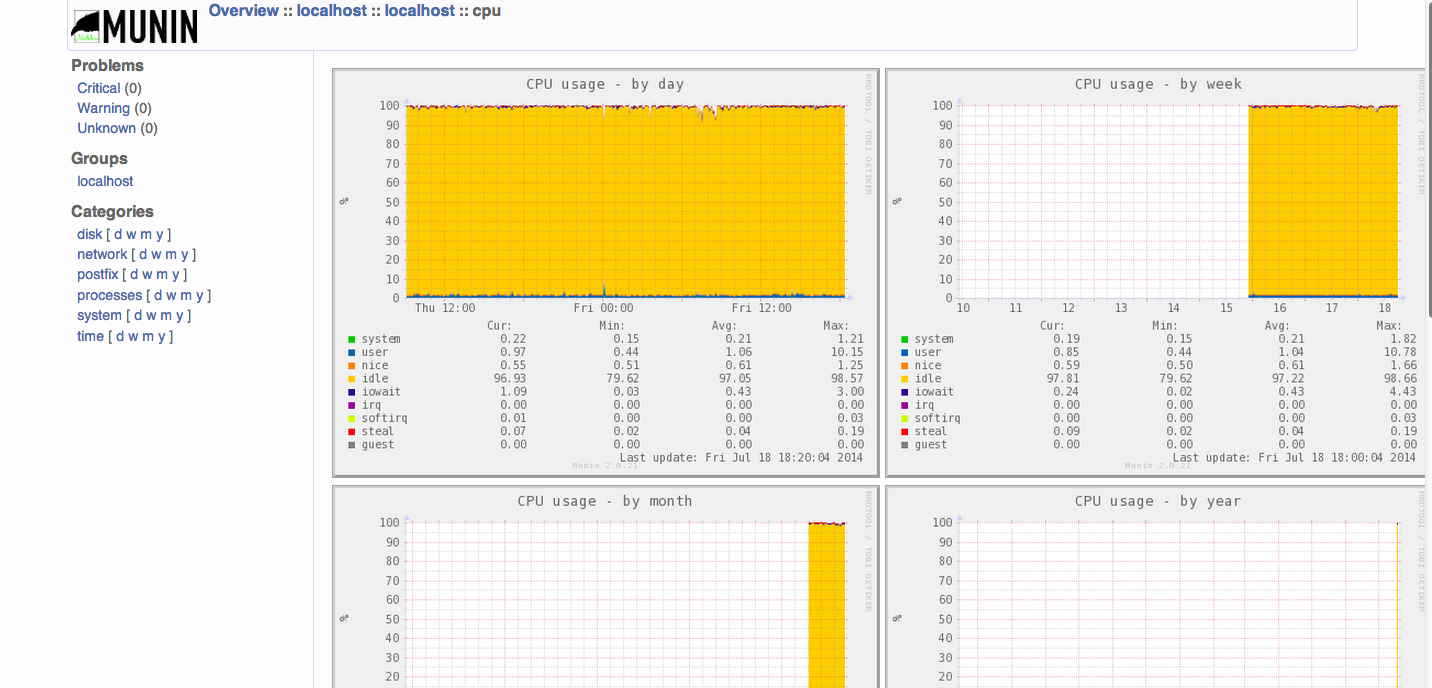
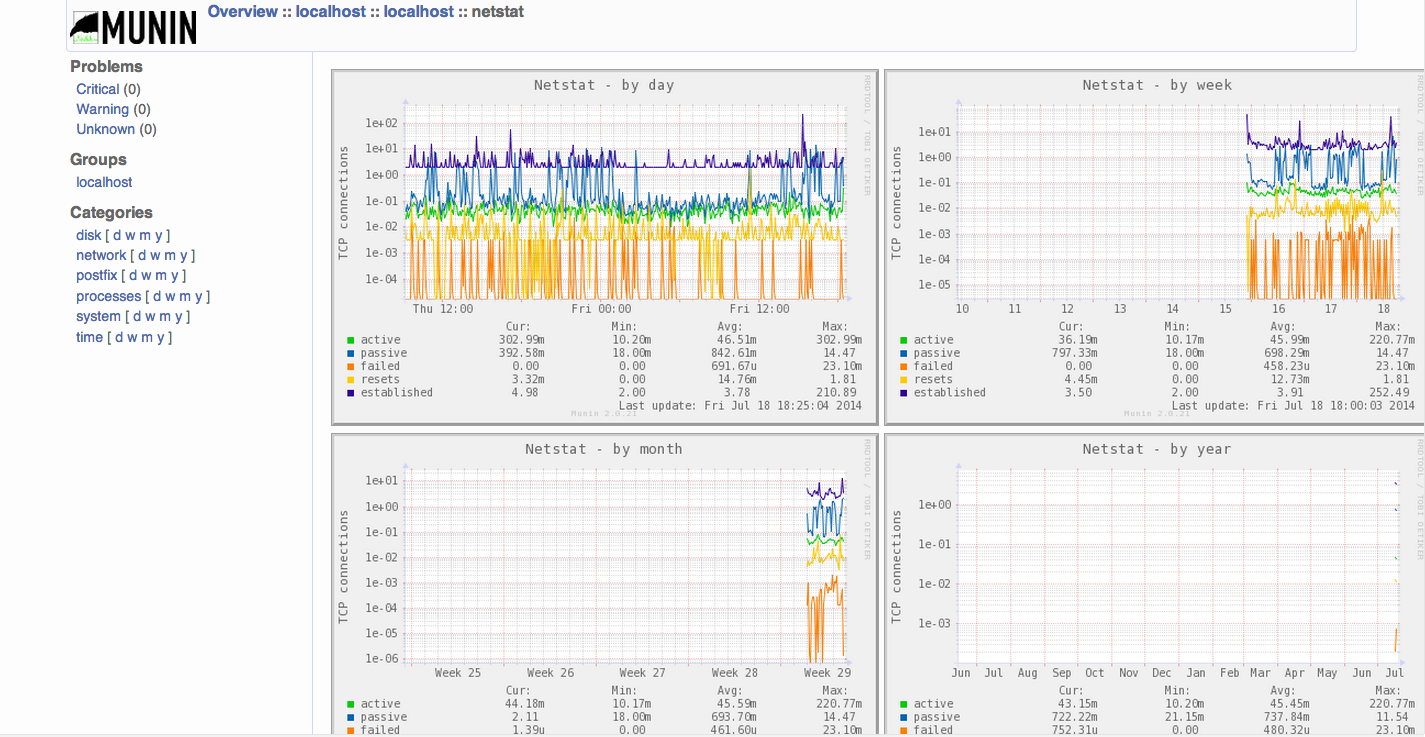
After waiting for 5-10 minutes for Munin to collect initial data and create graphs, open the page http://your.server/munin/ and enter the username and password - your monitoring system is now ready, collecting and displaying the main parameters of the operating system and applications in the form of graphs.
Need Help?
Our support team is available 24/7 to assist you with any questions or issues.
Contact Support