Monitoring and Managing Services with Monit on CentOS 7
A comprehensive guide on monitoring and managing services using Monit on CentOS 7, including installation, configuration, and monitoring examples.
Monitoring and Managing Services with Monit on CentOS 7
Monit is a simple and lightweight open-source server monitoring system. It can be easily installed on a server or SSD VDS and, after straightforward configuration, automates many health checks of services and resource availability analysis tasks.
Installation
Let’s consider the installation of Monit on CentOS 7. First, we will add the EPEL repository:
# wget http://dl.fedoraproject.org/pub/epel/7/x86_64/e/epel-release-7-7.noarch.rpm
# rpm -ivh epel-release-7-7.noarch.rpm
Next, install the Monit package:
# yum install monit
Enable and Start the Service
Enable auto-start, start the service, and check its status:
# systemctl enable monit
# systemctl start monit
# monit status
Configuration
Once Monit is running, configure it by editing the /etc/monitrc file. Basic settings:
set daemon 30         # check services every 30 seconds in daemon mode
set logfile syslog    # log file location
set mailserver         # configure the mail server for notifications
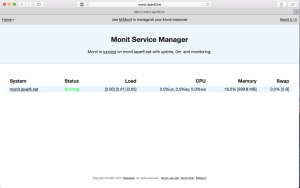
Enable the built-in web server (remember to change the default password):
set httpd port 2812 and
    allow 0.0.0.0/0
    allow admin:monit  # require user 'admin' with password 'monit'
Don’t forget to restart Monit after changes:
# service monit restart
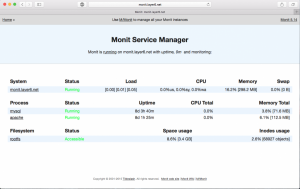
Monitoring Services
Add configuration files for services in /etc/monit.d/. For example, to monitor the Apache web server, create /etc/monit.d/httpd:
# Monitor the apache webserver
check process apache with pidfile /var/run/httpd/httpd.pid
    group www
    start program = "/usr/bin/systemctl start httpd"
    stop program = "/usr/bin/systemctl stop httpd"
    if failed host monit.layer6.net port 80 protocol http
        and request "/index.html" then restart
    if cpu is greater than 60% for 2 cycles then alert
    if cpu > 80% for 5 cycles then restart
    if totalmem > 500 MB for 5 cycles then restart
    if children > 250 then restart
    if loadavg(5min) greater than 10 for 8 cycles then stop
    if 3 restarts within 5 cycles then timeout
Next, for the MySQL server, create the /etc/monit.d/mysql file:
# Monitor MariaDB
check process mysql with pidfile /var/run/mariadb/mariadb.pid
    group database
    start program = "/usr/bin/systemctl start mariadb"
    stop program = "/usr/bin/systemctl stop mariadb"
    if failed host 127.0.0.1 port 3306 then restart
    if 5 restarts within 5 cycles then timeout
Also, you can monitor disk space:
# Space check
check filesystem rootfs with path /
    if space usage > 85% then alert
After updating, restart the monitoring system and interface:
Testing the Monitoring Functionality
Manually stop the MySQL server:
# service mariadb stop
Check the log file for monitoring messages:
[EST Nov 05 15:17:01] error : 'mysql' failed protocol test [DEFAULT] at [127.0.0.1]:3306 [TCP/IP] -- Connection refused
[EST Nov 05 15:17:01] info : 'mysql' trying to restart
[EST Nov 05 15:17:01] info : 'mysql' stop: /usr/bin/systemctl
[EST Nov 05 15:17:03] info : 'mysql' start: /usr/bin/systemctl
[EST Nov 05 15:17:38] info : 'mysql' connection succeeded to [127.0.0.1]:3306 [TCP/IP]
The service restarted automatically, demonstrating how Monit can help with routine operations. Highly recommended!
Need Help?
Our support team is available 24/7 to assist you with any questions or issues.
Contact Support